
Free learning resources for data scientists are available online on my blog and YouTube channel! Try my free online courses, and subscribe to my weekly e-newsletter!
Tag Archives: Statistics

13
Jul
Jul
Portfolio project examples are sometimes needed for newbies in data science who are looking to complete independent projects. This blog post provides some great examples of independent projects you can do with datasets available online!

03
Apr
Apr
Making upset plots with R package UpSetR is an easy way to visualize patterns of attributes in your data. My blog post demonstrates making patterns of co-morbidities in health survey respondents from the BRFSS, and walks you through setting text and color options in the code.

16
Mar
Mar
Can you name categories other than “food” and “drugs” that are regulated by the FDA in the US? Read this blog post to learn what they are, and what the FDA does in the US.
16
Feb
Feb
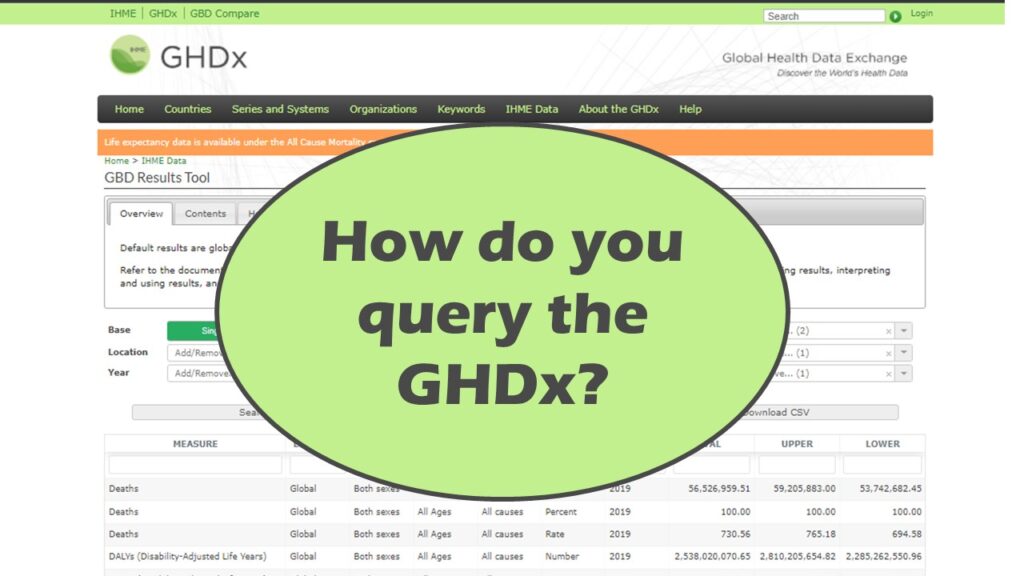
Querying the GHDx database is challenging because of its difficult user interface, but mastering it will allow you to access country-level health data for comparisons! See my demonstration!
04
Feb
Feb
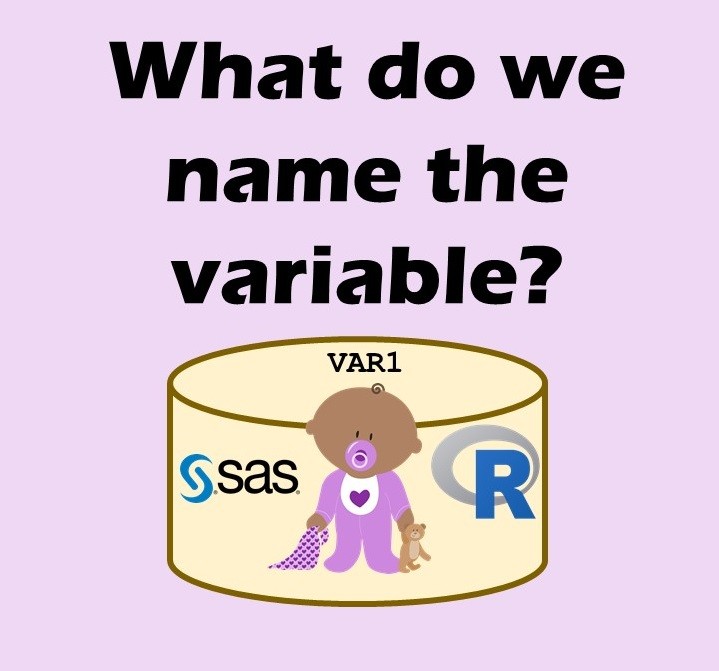
Variable names in SAS and R are subject to different “rules and regulations”, and these can be leveraged to your advantage, as I describe in this blog post.
Career Development
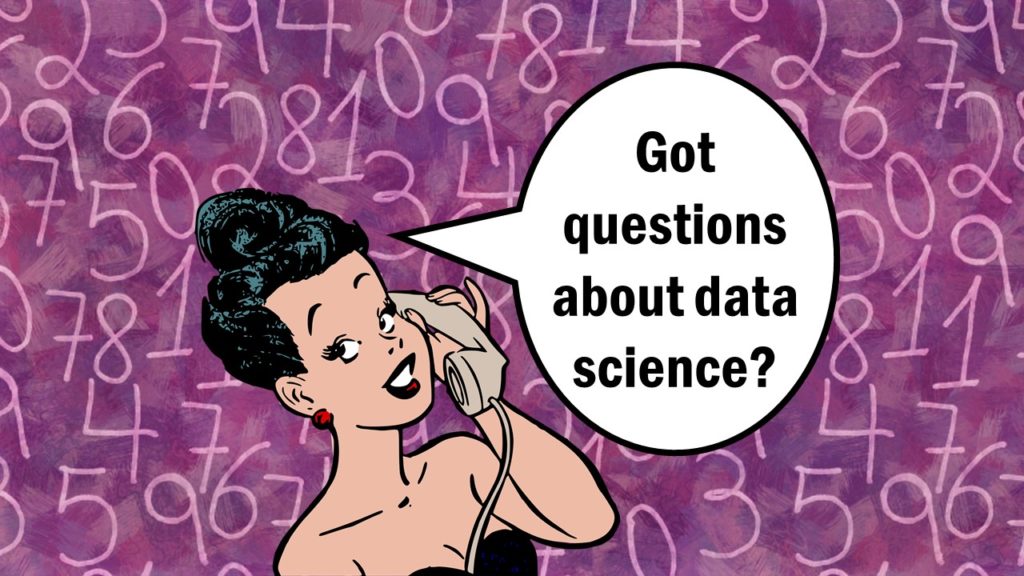
Answer Your Data Science Questions by Attending my Livestream Discussions on YouTube!
15
Jan
Jan
Answer your data science questions by attending my livestreams on YouTube and interacting in chat! Learn more about this in my blog post.

13
Jan
Jan
Data science YouTube channel that brings you educational resources, career advice, live interactive sessions, and keeps you up-to-date in innovation and analytics – that’s what I have planned for 2022! Read my blog post for details.

13
Dec
Dec
Having trouble getting your research published? I can write your peer-reviewed article for $4,000. That sounds too cheap, right? This blog post explains why I can offer such a low price while still delivering high quality.
Data Science
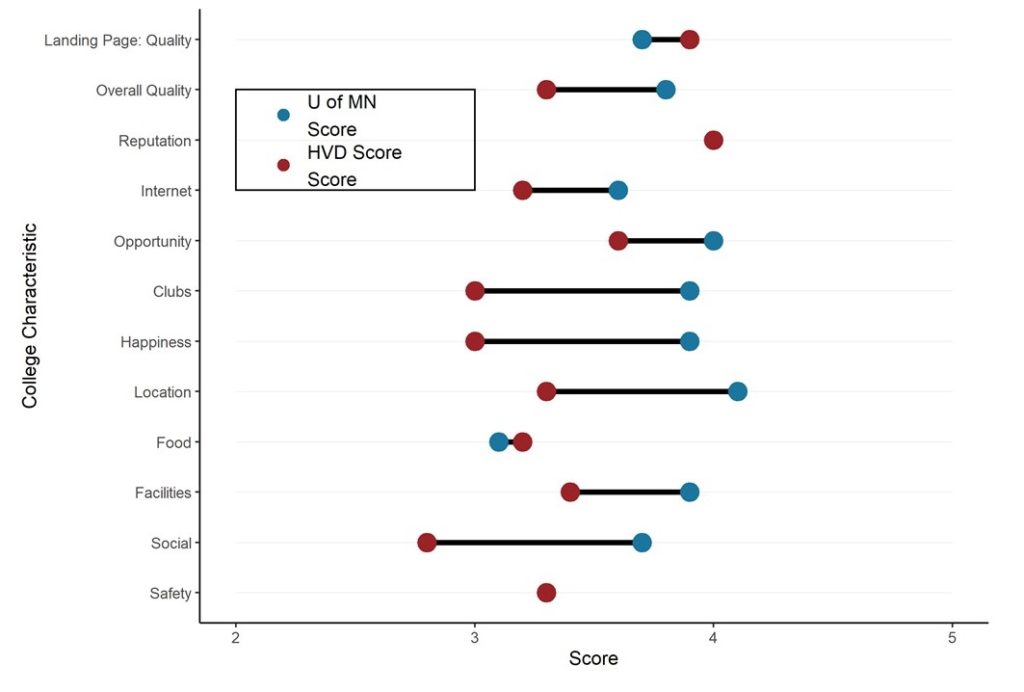
Dumbbell Plot for Comparison of Rated Items: Which is Rated More Highly – Harvard or the U of MN?
20
Sep
Sep
Want to compare multiple rankings on two competing items – like hotels, restaurants, or colleges? I show you an example of using a dumbbell plot for comparison in R with the ggalt package for this exact use-case!